
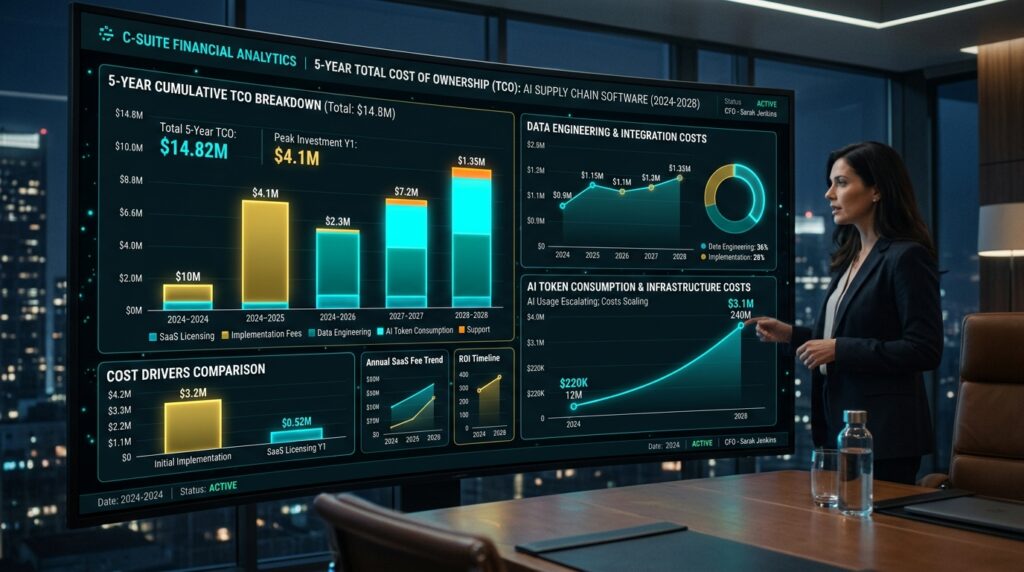
When analyzing the Enterprise AI Supply Chain Software TCO in 2026, most supply chain transformations do not fail because the software algorithms are flawed. They fail because executive teams evaluate software based on vendor licensing quotes while ignoring the massive operational, data engineering, and organizational tax required to make AI functional.
Transitioning from legacy, deterministic Supply Chain Planning (SCP) systems to advanced artificial intelligence platforms—leveraging digital twins, dynamic simulation, and autonomous agentic workflows—promises higher demand forecast accuracy and optimized multi-echelon inventory. However, determining the true financial commitment requires looking past glossy sales decks.
A rigorous Total Cost of Ownership (TCO) analysis must evaluate not just upfront subscription tiers, but the hidden lines: data pipeline engineering, algorithm drift governance, cross-functional re-education, and compute economics.
Here is a breakdown of how enterprise AI supply chain software is priced, where the hidden costs lie, and how CTOs and procurement leaders can structure investments for maximum ROI.
1. Taxonomy of Commercial Pricing Models
Enterprise AI supply chain vendors employ a variety of commercial models structured around corporate architecture, digital maturity, and functional breadth.
Subscription and SaaS per Module
Under modular SaaS models, vendors split the planning ecosystem into targeted functional applications: Demand Forecasting, Inventory Optimization, Supply Planning, Production Scheduling, and Integrated Business Planning (IBP). Platforms like Oracle Fusion Cloud SCM and Logility rely heavily on modular SaaS pricing, allowing enterprises to start with high-priority pain points before committing to end-to-end planning suites.
Tiered Pricing by Managed Revenue and SKU Volume
Processing millions of Stock Keeping Unit (SKU) and location combinations generates heavy compute overhead. To match costs with business scale, vendors like o9 Solutions tier their subscription fees directly against Annual Managed Revenue (AMR), total trade volume, or active SKU-location complexity.
User-Based vs. Unlimited Seat Licensing
Per-user seat models remain standard for legacy platforms, charging $200 to $400 per user monthly for full operational access. However, user-based pricing creates artificial barriers between teams during Sales and Operations Planning (S&OP) workflows. To encourage cross-functional adoption, select AI-native platforms now offer enterprise-wide licensing with unlimited user seats, tying commercial fees entirely to managed trade volume or active network nodes.
Generative AI and Agentic Compute Economics
The integration of autonomous AI agents—executing tasks like dynamic re-routing, exception triage, and scenario modeling—introduces token-burn and compute-credit consumption models.
Agentic AI workflows run continuous reasoning loops, Retrieval-Augmented Generation (RAG), and external API tool calls. At a blended rate of roughly $3.00 per million tokens, an enterprise deploying an eight-agent planning cluster spends approximately $21,024 annually in raw token usage alone. However, real-world operational costs run 2x to 5x higher once you factor in vector database maintenance, orchestration layers, security guardrails, and governance.
Vendor Pricing & Implementation Matrix
| Vendor Platform | Target Enterprise Profile | Core Pricing & Licensing Mechanics | Typical Implementation Timeline |
| o9 Solutions | Global enterprises; high digital maturity | Value-based SaaS driven by scope, processed data volume, and model complexity | Agile, phased MVP-based rollout |
| Kinaxis (Maestro) | Volatile markets; complex manufacturers | Value-based SaaS scaling with network node complexity | Multi-phase agile deployment |
| Oracle Fusion Cloud SCM | Global multi-location enterprises | Tiered SaaS based on modules, user seats ($150–$300/user/mo), and transaction volume | 9 to 18+ months enterprise integration |
| Anaplan for Supply Chain | Mid-to-large cross-functional planning | Model size, workspace memory usage, and user seat license tiers | 3 to 9 months depending on scope |
| Logility | Mid-to-large process/discrete manufacturing | Modular SaaS subscription based on functional scope and volume | Progressive, incremental module rollout |
| Slimstock (Slim4) | Mid-market to large distribution & retail | Annual contract value ($100K–$500K range) based on locations and SKU complexity | Rapid deployment using pre-configured templates |
| Datup AI | Mid-to-large enterprises (+$10M revenue) | Custom monthly SaaS based on trade volume with unlimited user seats | Accelerated deployment (< 5 weeks) |
Operational Impact
Choosing between a per-user model and a volume-based model isn’t just a finance decision—it’s a cultural one. Per-user licensing forces companies to restrict platform access, driving finance and sales teams back into offline spreadsheets. If cross-functional S&OP alignment is your primary bottleneck, prioritize volume-based or unlimited-seat models to eliminate friction.
2. Enterprise AI Supply Chain Software TCO: Benchmarks & Trajectory
Calculating the financial commitment requires balancing initial deployment charges against long-term operational costs.
Implementation-to-License Ratios
First-year consulting and integration services routinely exceed the base annual software license fee. For specialized planning and inventory optimization platforms, initial implementation services average 1.5x to 2.5x the annual subscription cost in Year 1. Enterprise-wide management platforms generally sit between 1.0x and 2.0x.
Annual Contract Value (ACV) Tiers
- Mid-Market ($50K – $250K ACV): Specialized point solutions covering focused manufacturing or distribution footprints.
- Mid-to-Large Enterprise ($100K – $500K ACV): Broader suites handling multi-site inventory and demand planning.
- Global Enterprise ($400K – $3M+ ACV): Connected enterprise platforms (e.g., Anaplan, Kinaxis) spanning multi-tier networks.
- Fortune 500 Enterprise ($2M – $15M+ ACV): Deep algorithmic customization, massive data processing, and global digital twins for CPG, automotive, or pharmaceutical giants.
Discounted Multi-Year TCO Horizon
Over a standard 3-to-5-year evaluation window, operational spend stabilizes in Years 2 and 3 at 60% to 70% of total Year 1 expenditure.
The multi-year financial trajectory is formally modeled as:
$$TCO_n = C_{\text{acq}} + C_{\text{impl}} + \sum_{t=1}^{n} \frac{C_{\text{lic},t} + C_{\text{maint},t} + C_{\text{data},t} + C_{\text{change},t}}{(1+r)^t}$$
Where:
- $C_{\text{acq}}$ = Initial platform setup fees
- $C_{\text{impl}}$ = Year 1 integration and SI consulting
- $C_{\text{lic},t}$ = Recurring SaaS subscription in year $t$
- $C_{\text{maint},t}$ = Support, administration, and system governance
- $C_{\text{data},t}$ = Ongoing data engineering and external API enrichment
- $C_{\text{change},t}$ = Continuous training and adoption programs
- $r$ = Corporate discount rate
- $n$ = Planning horizon (years)
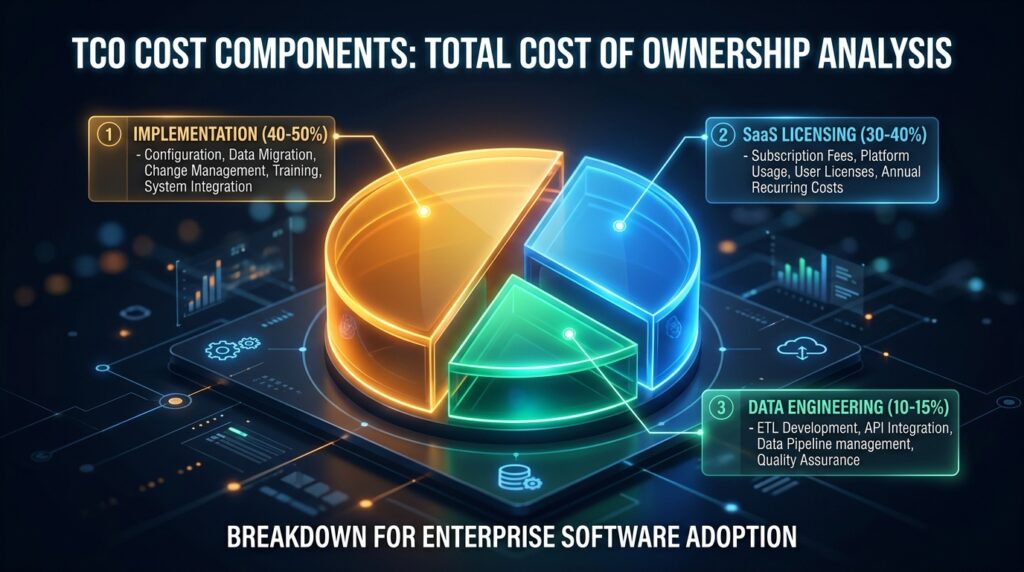
TCO Expenditure Allocation
| TCO Cost Component | Year 1 Allocation | Years 2–3 Run-Rate | Primary Cost Drivers |
| Software SaaS / Licensing | 30% – 40% | 50% – 60% | Module scope, SKU volume, active nodes, token tiers |
| System Implementation | 40% – 50% | 5% – 10% | Third-party SI fees, custom API builds, ERP/WMS connectors |
| Data Engineering & Cleansing | 10% – 15% | 10% – 15% | Master data cleanup, ETL pipelines, third-party data feeds |
| Change Management & Training | 5% – 10% | 5% – 10% | Planner retraining, process updates, temporary productivity loss |
| Support & Governance | 5% – 10% | 10% – 15% | Tier-1 SLA support, internal admins, model drift oversight |
3. The Anatomy of Hidden Costs and Implementation Friction
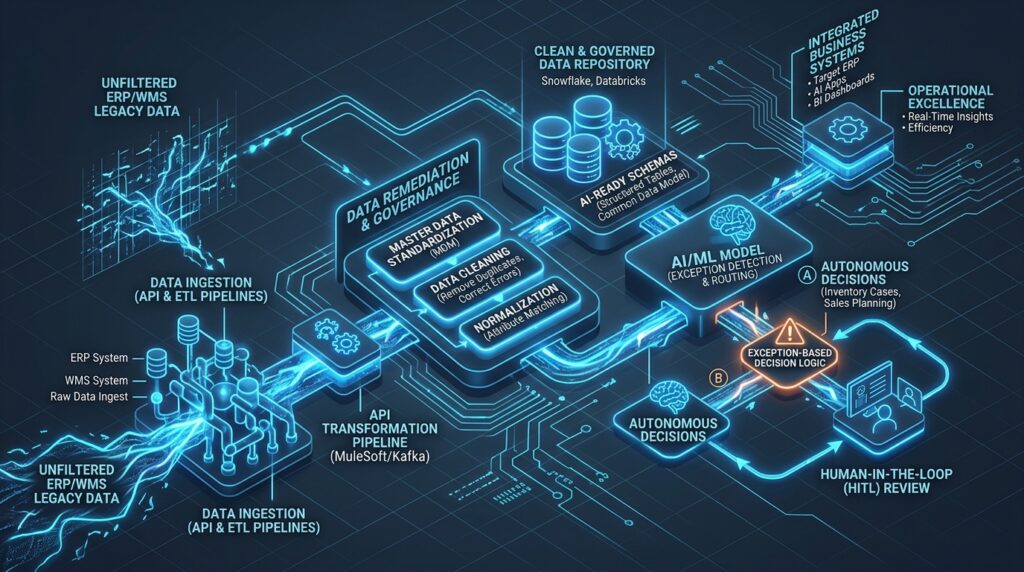
Budget overruns rarely come from unexpected SaaS license fees. They stem from underestimating the secondary operational heavy lifting required to make AI models accurate.
       [ Uncleaned Legacy ERP / WMS / POS Data ]
                          │
                          ▼ (High API Engineering Costs)
       [ Unified Data Foundation & Clean Master Data ]
                          │
                          ▼ (Algorithm Fine-Tuning)
       [ AI / Machine Learning Engine Deployment ]
                          │
                          ▼ (Change Management & Adoption)
       [ Exception-Based Autonomous Decision-Making ]
1. Data Engineering and Master Data Cleanup
Machine learning algorithms cannot generate reliable baselines from messy data. Extracting, transforming, and loading (ETL) legacy ERP, WMS, and Point-of-Sale (POS) records into an AI-ready schema is often the single largest expense. Furthermore, external signals—like weather trends, macroeconomic indexes, and carrier tracking—require ongoing third-party API subscription fees.
2. Model Customization and Algorithm Drift
Out-of-the-box machine learning algorithms rarely account for complex lead-time variability, dynamic price elasticity, or multi-echelon risk pooling without custom domain tuning. Post-deployment, as market conditions and consumer behaviors evolve, models experience drift. Organizations must budget for dedicated internal application owners or external advisory hours to monitor exception logs and re-align model parameters continuously.
3. Organizational Change Management
AI changes the planner’s job from manual spreadsheet tinkering to exception-based governance. When planners don’t trust algorithmic output, they manually override software recommendations, destroying software ROI. Overcoming this requires structured training and executive alignment. During implementation, key internal talent will be diverted to support validation—meaning companies must account for temporary operational backfill costs.
Editor’s Perspective
Buying AI software before cleaning your master data is like putting high-octane racing fuel into a car with a cracked engine block. If your SKU dimensions, lead times, or bill-of-materials (BOM) mappings are inaccurate in your ERP, AI will simply calculate wrong decisions much faster. Prioritize a data readiness audit before signing a software contract.
4. ROI Dynamics and Measurable Performance Benchmarks
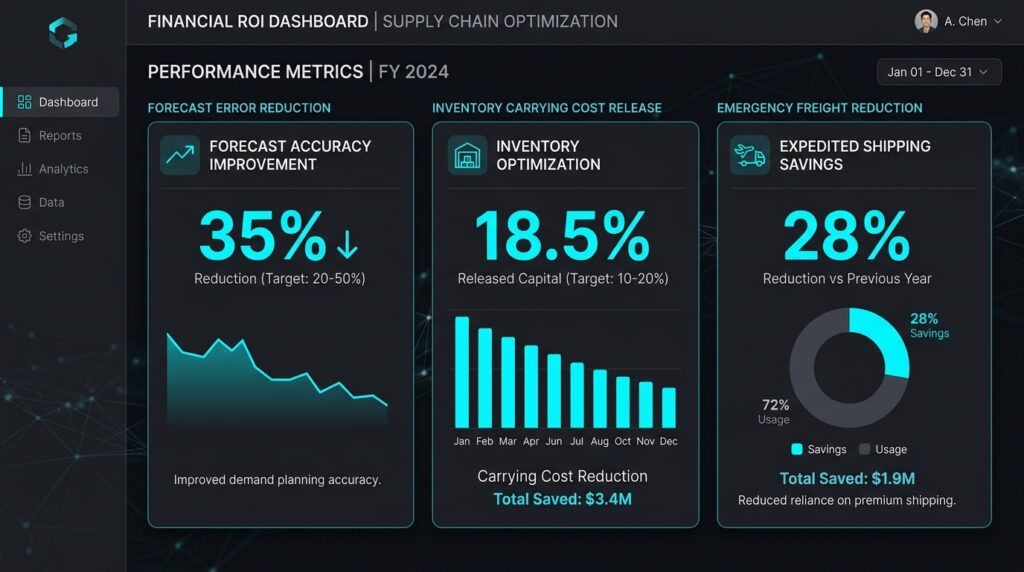
Justifying an enterprise AI supply chain investment requires tying expenditures directly to balance sheet improvements and working capital release.
Time-to-Value Horizon
- Inventory Optimization: Yields the fastest direct payback. Multi-echelon inventory optimization (MEIO) can rebalance safety stocks and release working capital within 6 to 12 months.
- Integrated Business Planning (IBP): Delivers full net-positive returns within 14 to 24 months as cross-functional process alignment matures across finance, sales, and operations.
Achievable Enterprise Benchmarks
| Operational Metric | Baseline Legacy Performance | Post-AI Deployment Benchmark | Direct Business Mechanism |
| Forecast Error (MAPE) | High statistical baseline variance | 20% – 50% reduction (+5–15% MAPE accuracy) | Aligns procurement with true demand; reduces stockouts |
| Inventory Carrying Value | High safety stock buffers | 10% – 20% balance reduction | Unlocks working capital; reduces warehousing & obsolescence |
| Emergency Freight Costs | Reactive re-routing & expediting | Up to 28% cost reduction | Identifies bottlenecks early to avoid expedited shipping |
| On-Time In-Full (OTIF) | Manual tracking & static lead times | Up to 37% delivery improvement | Enhances multi-node network visibility & capacity planning |
| Customer In-Stock Fill Rate | Unpredictable stockouts across nodes | Sustained 90% – 95%+ fill rates | Prevents lost sales and improves long-term customer retention |
5. Strategic Procurement Framework & Recommendations
To maximize returns and mitigate risk, enterprise technology leaders should follow these actionable guidelines:
1. Model TCO Over a 5-Year Horizon
Reject vendor proposals that only showcase Year 1 software fees. Demand complete visibility into setup charges, implementation consultant rates, post-launch support tiers, and potential token/compute overage charges over a 5-year timeline.
2. Lock In Contractual Escalation Caps
SaaS vendors frequently include default 10% to 15% annual renewal price increases. Procurement teams should negotiate capped renewal adjustments tied directly to standard Consumer Price Index (CPI) metrics or capped at 3% to 5% annually within initial multi-year contracts.
3. Demand Outcome-Based Proofs-of-Concept (POC)
Before committing to full enterprise deployment, require vendors to execute a structured POC using your historical, anonymized enterprise data. Test machine learning forecast accuracy against your existing baseline and stress-test real-time API performance against legacy ERP architectures.
4. Establish SLAs for Algorithmic Governance
Ensure contracts include explicit Service Level Agreements (SLAs) not just for platform uptime, but for algorithm performance, model retraining intervals, support responsiveness, and data privacy compliance.
What to Do Next
If you are evaluating AI supply chain planning software for your enterprise, take these immediate steps:
- Audit Master Data Quality: Run an internal audit on lead time accuracy, SKU mapping, and inventory logs across your primary ERP/WMS instances before requesting vendor proposals.
- Determine Primary Commercial Metric: Evaluate whether a per-seat, volume-tier, or unlimited-user model best aligns with your team’s collaboration needs.
- Benchmark Current Forecast Error: Document your baseline MAPE and emergency freight spend so you can hold vendors accountable to measurable ROI targets during contract negotiations.
To evaluate how enterprise supply chain software pricing compares with vendor architectures, AI compute infrastructure, and cloud network economics, explore our technical benchmarks across the enterprise tech ecosystem:
- Enterprise Supply Chain Software & Platform Evaluations: Compare market leaders in our Best Enterprise AI Supply Chain Planning Platforms Review and explore the Top 10 AI Supply Chain Software and Platforms for 2026.
- Enterprise AI Compute & Decision Matrices: Evaluate hosting paradigms in our Bare-Metal vs Workstation vs Serverless GPU Decision Matrix and analyze unit economics in the AWS EC2 vs RunPod vs Hyperbolic Review.
- Custom LLM Deployment & Infrastructure Optimization: Deploy specialized reasoning engines using Deploying Serverless DeepSeek-R1 on RunPod with vLLM, calculate VRAM needs in the Sovereign LLM Hardware Sizing Guide on Lambda, and slash transit costs in How to Slash Cloud Egress Fees. Bookmark AI Review Zones for continuous enterprise technology coverage.
References
- Oracle Fusion Cloud SCM Documentation – Official platform overview, module architecture, and enterprise integration guidelines.
- o9 Solutions Platform Overview – Specifications on graph-based enterprise knowledge management and value-based subscription structures.
- Kinaxis Maestro Platform Specifications – Technical architectural framework for continuous planning and concurrent supply network orchestration.
- Anaplan for Supply Chain Solutions – Overview of dynamic scenario modeling, workspace sizing, and enterprise cross-functional planning mechanics.
- Logility Digital Supply Chain Platform – Detailed breakdown of AI-driven demand forecasting, inventory optimization, and modular SaaS capabilities.
- Gartner Supply Chain Technology Research – Market benchmarks on enterprise supply chain software evaluation, implementation trends, and TCO modeling.
- InfoWorld: The Real Cost of Agentic AI – Analysis of compute infrastructure, token consumption economics, and operational overhead in enterprise AI agents.